The Cotswolds National Landscape is a designated Area of Outstanding Natural Beauty (AONB). It is made up of 204,270 hectares spanning six counties and a variety of landscapes. In this pilot project, funded by Natural England, the aim was to investigate how an integrated approach using offline ecosystem service mapping together with an online dashboard could help this and other AONBs / National Landscapes in meeting their nature recovery reporting requirements. This process is often compromised by heterogeneous or incomplete data.
Environment Systems was tasked with creating the ecosystem service maps using its SENCE ecosystem service modelling tool.
The ecosystem service modelling focused on four services: carbon storage, water quality regulation, water flow regulation (natural flood management), and farming. Additionally, nature recovery networks were modelled to highlight areas of particular biodiversity value. Working closely with project partner Triage, a data dashboard was conceived which could support nature recovery reporting and form the basis for monitoring moving forwards.
Using the web-based data dashboard implemented by Triage, the data can be viewed, queried, and summarised by a wide range of stakeholders without requiring the user to have Geographical Information System expertise. The data is presented in a
range of tabs (Habitats, Nature Recovery, and each of the ecosystem services, which are in turn broken down into their component parts (e.g. stock and opportunities for most of the ecosystem services).
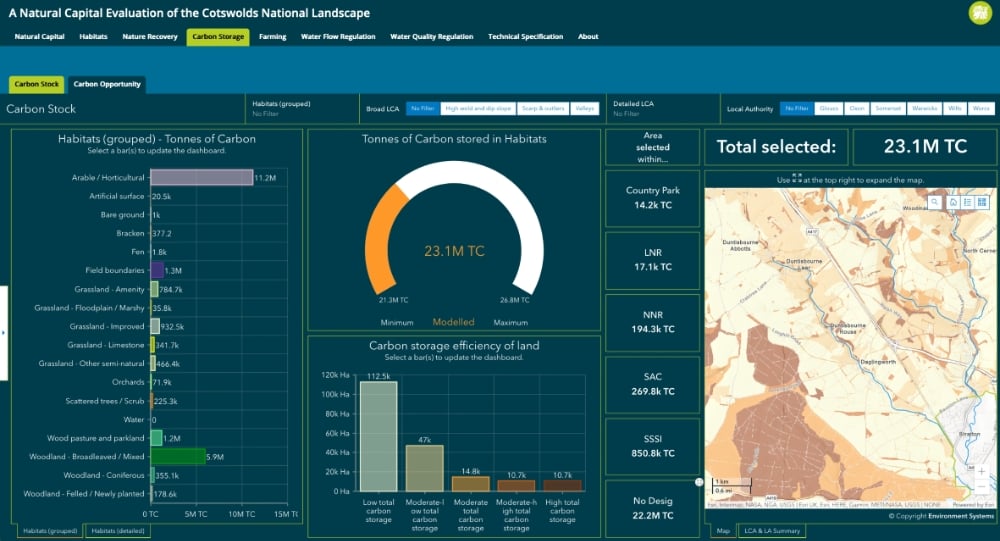
The carbon stock dashboard shows the values produced on a by-pixel basis, but these are then converted to a format more suitable for reporting. On the dashboard, this information is converted to the actual storage in tonnes of Carbon, so that, when filtering, for example, to a broad habitat the bar charts will show the total amount of carbon stored within that habitat.
The project has demonstrated that the integration of ecosystem service modelling with the online dashboard was particularly helpful to Cotswolds staff, as it meant that data could be summarised flexibly to match reporting areas without requiring any in-house data manipulation.