
Summary
- Assessed changes in agriculture in conflict-affected regions of Libya
- Thousands of satellite images analysed
- Outcomes reveal shifts in the location of agricultural areas
Outcomes
- Reduction in overall agricultural area post-2011
- Increase in the proportion of high-intensity agriculture
- Changes in land use practices observed
- Evidence to inform effective policies and programming
Benefits
- Scalable, repeatable approach
- Greater understanding of food security
- Ability to monitor future change over time
Context
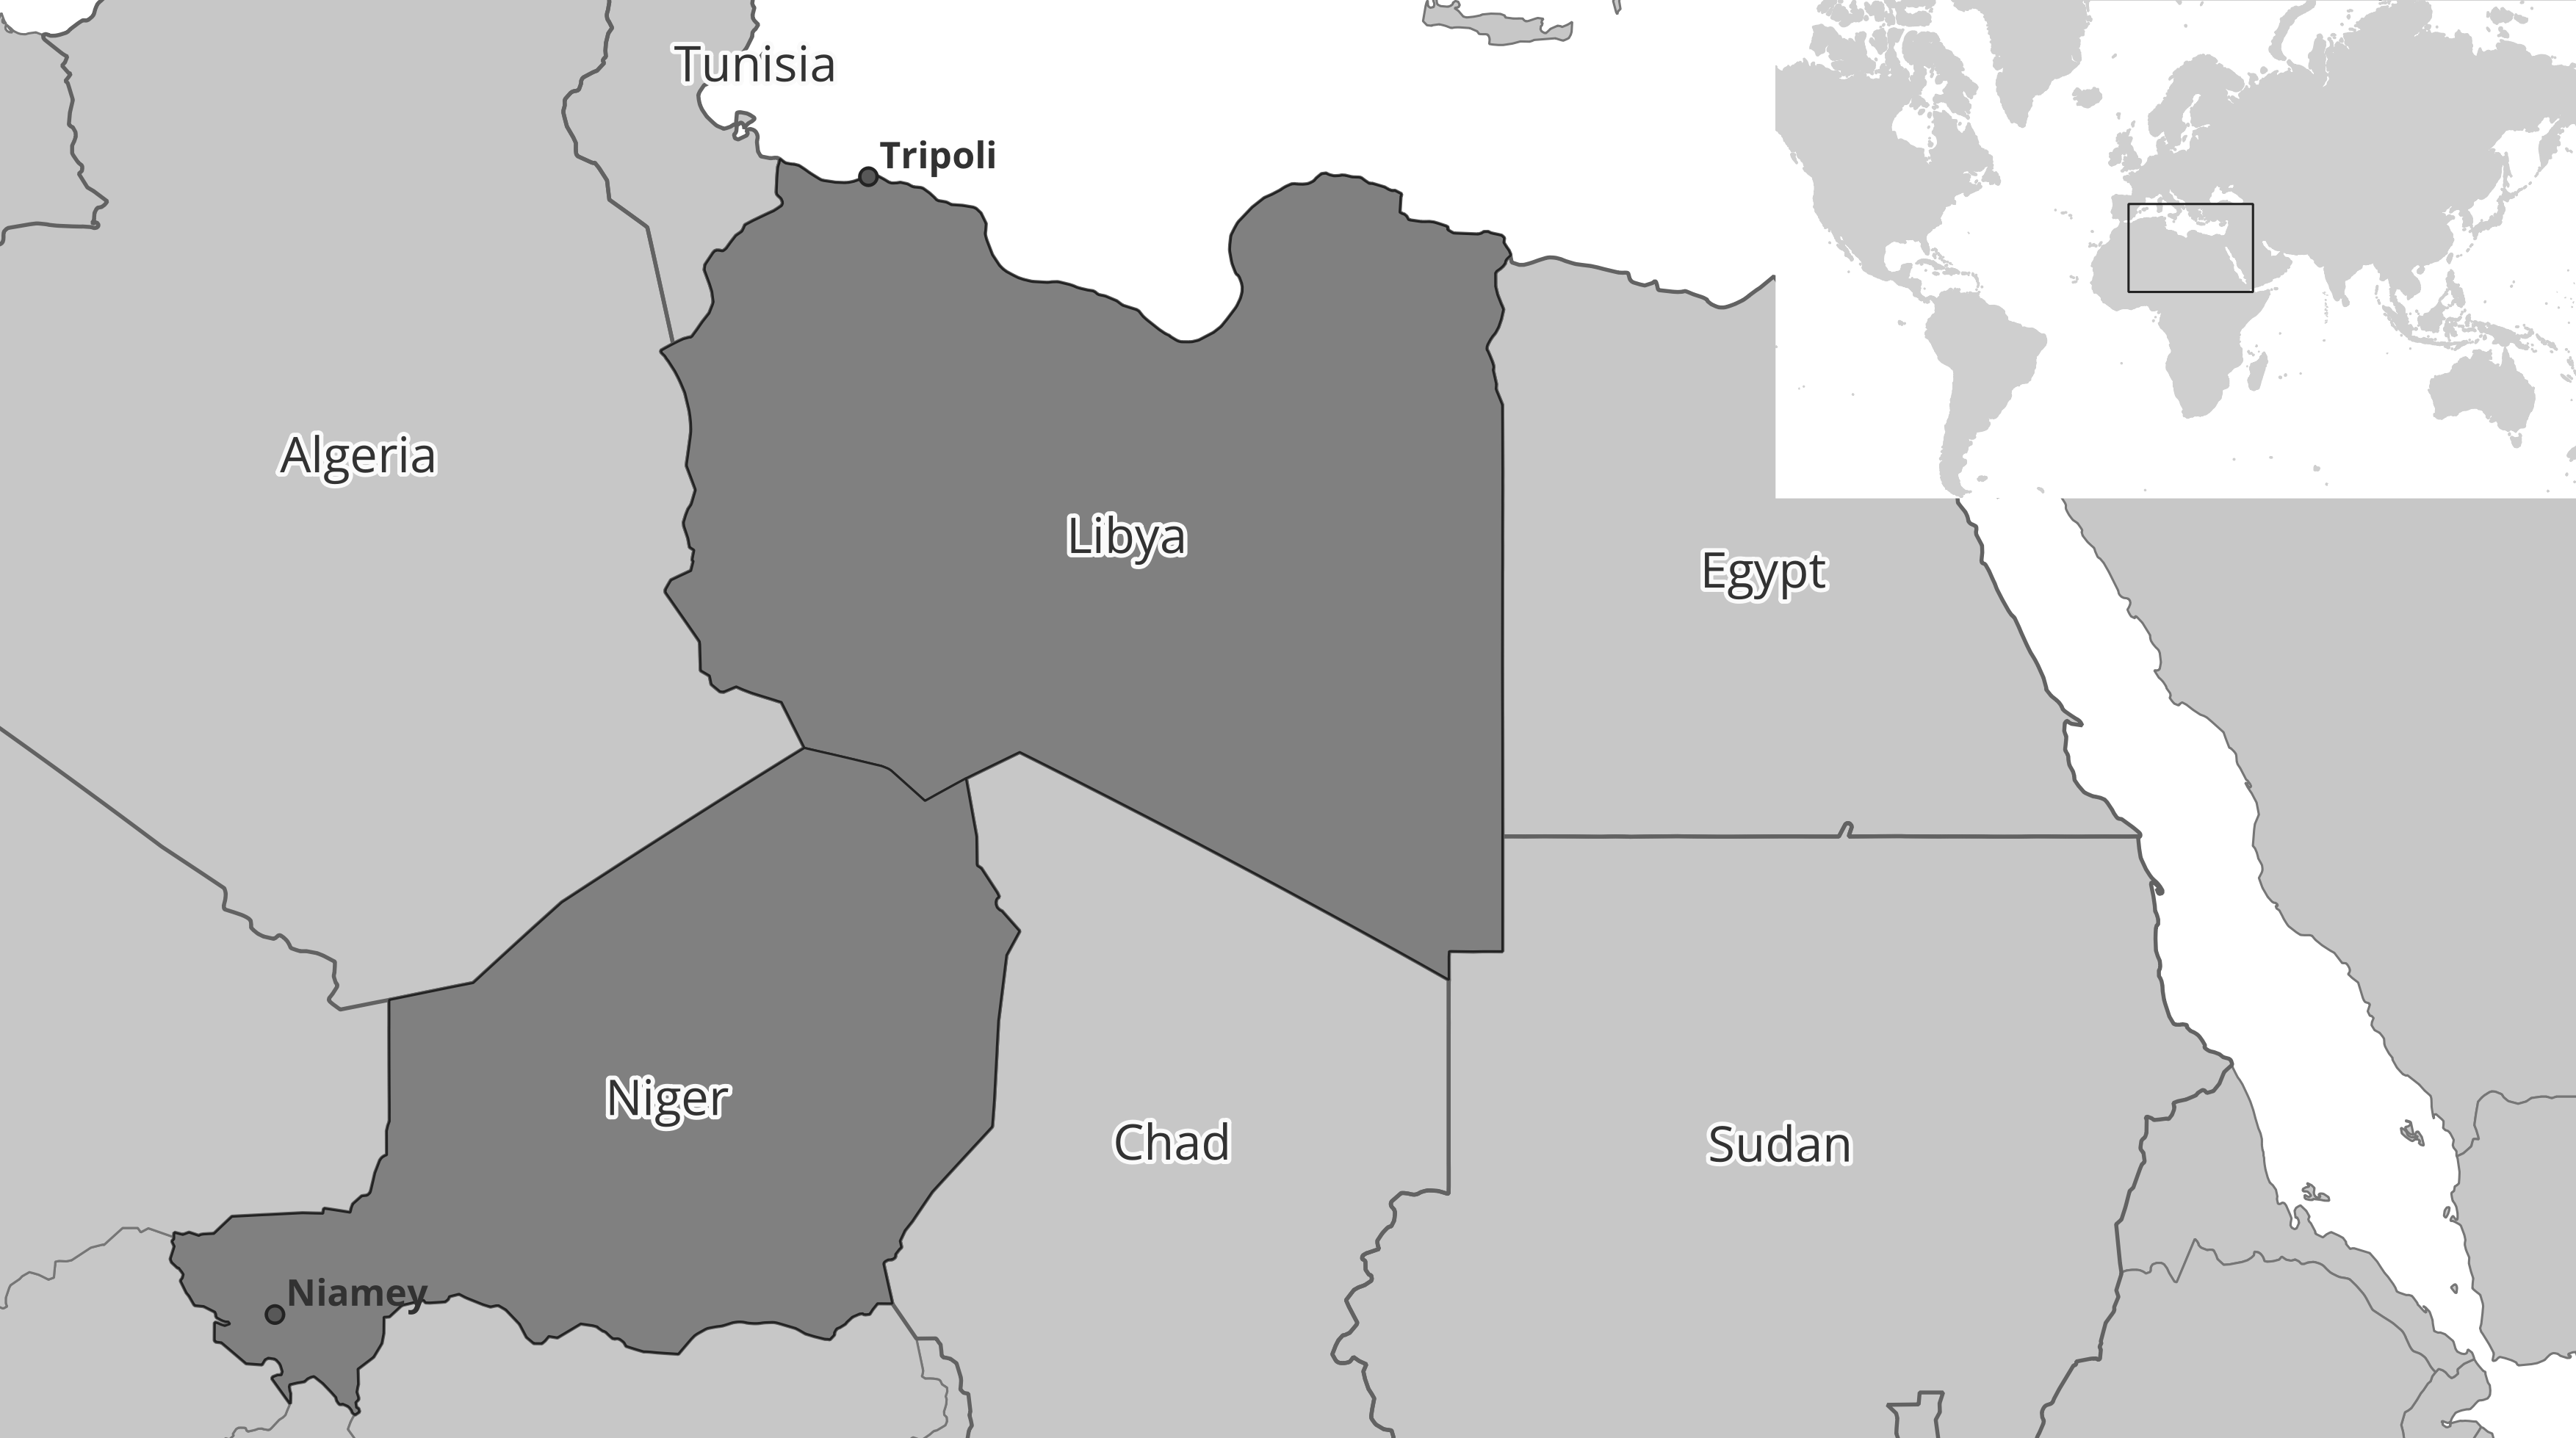
Libya, the fourth-largest country in Africa, is almost entirely covered by the Libyan Desert, a flat plateau that’s part of the Sahara, the world’s largest hot desert. Most of Libya’s population live in cities along the Mediterranean Sea, where the climate is milder than the country’s hot desert interior.
Since 2011, Libya has experienced a humanitarian crisis and political-military instability that have greatly impacted Libya’s social fabric, basic services, and national infrastructure. This has become known as the Libyan Crisis.
What we did
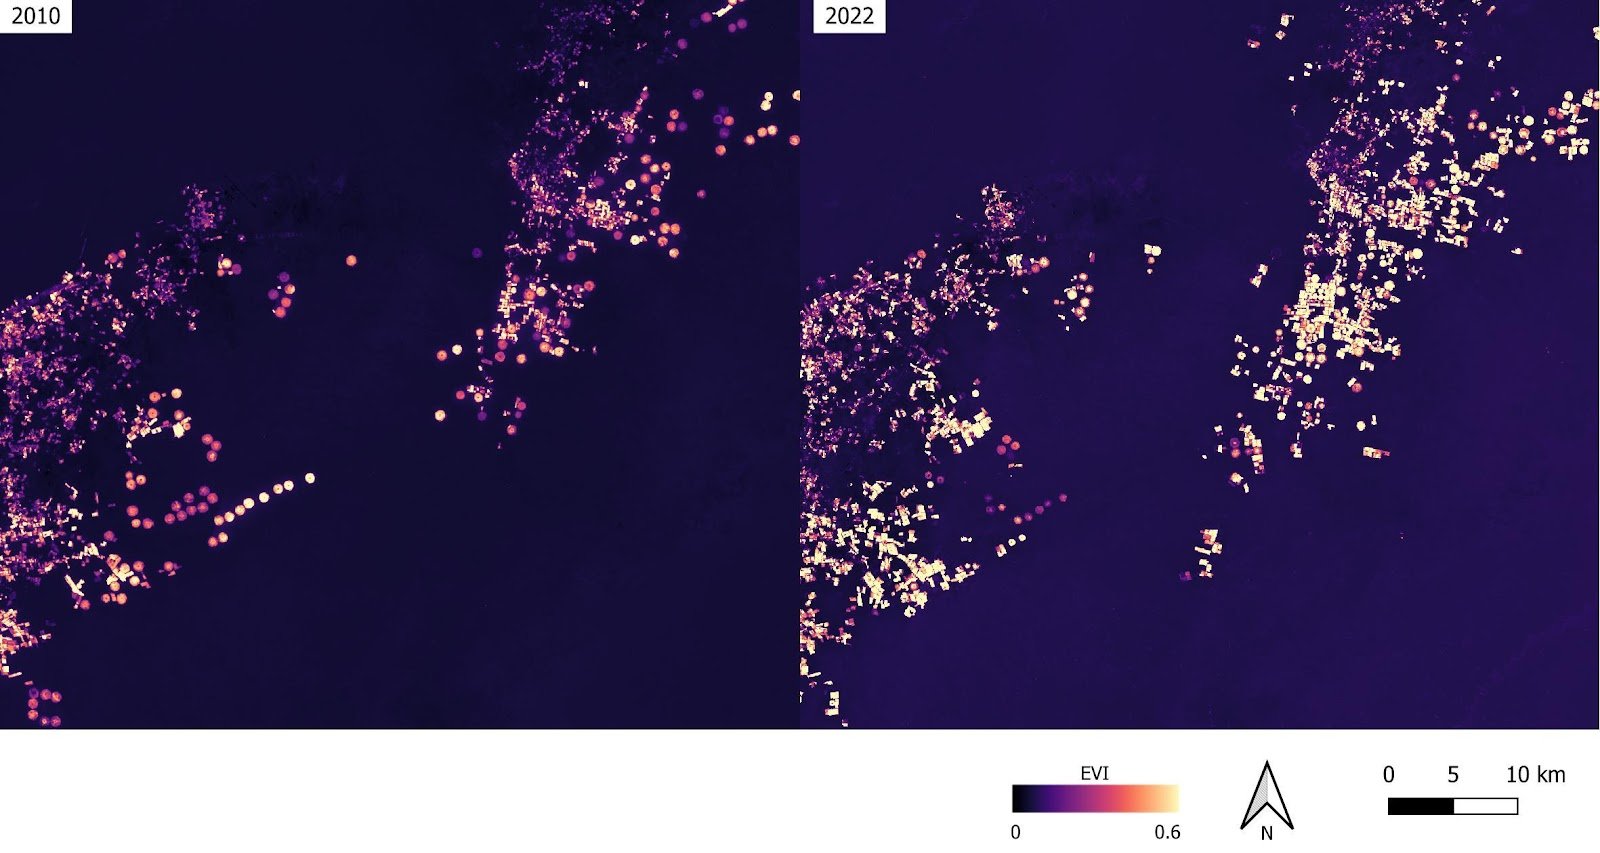
We were tasked with understanding how agricultural production has changed following the Libyan Crisis. Five areas across southern Libya and Niger were provided to us. Agricultural land use in these areas is divided between smallholder plots near to settlements, and extensive agro-industrial production. Satellite imagery from Landsat and Sentinel-2 was used to create an Enhanced Vegetation Index (EVI). We used this as the basis for assessing the intensity of agricultural areas (Figure 2). In addition, a cropland “mask” was created to exclude non-agricultural areas from the analysis. Using these, we were able to distinguish between low-intensity and high-intensity agricultural land.

Outcomes
We found that there was typically a reduction in overall agricultural area post-2011, possibly a result of political turmoil. We also observed an increase in the proportion of large-scale agriculture in both pivots (a method of crop irrigation in which equipment rotates in a circle) and traditional fields. Interestingly, pivots in 2010 were concentrated in a few areas. However, by 2022 they are interspersed with traditional fields. This indicates a potential change in land use practices in the region (Figure 3).
In another study area, multiple pivot fields were established in 2013. These pivots are also associated with the expansion of smallholder fields in the area (Figure 4). This suggests that there has been investment in the area alongside which there has been growth in the size of the local community.

Summary
We conducted a comprehensive analysis of the change to agricultural production across areas in Libya and Niger. This involved analysing thousands of satellite images, the results of which are complex, with variation in agricultural areas detected. There is some evidence of changes in agricultural production around 2013-2014. However, this is subtle, and is typically followed by moderate increases in both overall and high-intensity cropped areas.
While there is evidence of abandonment of large-scale production in some locations, there is a pattern of production shifting to new locations, rather than reducing as a whole. The pivot fields may warrant additional consideration as they require a degree of investment to create and manage, and are readily identifiable in the imagery.